- Descriptive basic [µ]
- Percentile or Quantile
- Variance
- Standard deviation
- Correlation coefficient
- Probability theory
- Events: dependent or independent or ...
- Representative sets or ...
- The Central Limit Theorem
- Conclusion of the results
- Regression analysis
- Program Evaluation [Where its possible ...]
- Five question where statistics can ask
- Polling
- Percentage
- Tree of the variants
- Repeatable research
- Expected value for game ...
- I want any result;
- What has each ... already ... or meant or ... or been extremely or done more often?
- I set term or rule or part of rule of answer to "get" part of the result or complete result;
- ... ;
Descriptive basic [µ]
Median is middle values of any sets of n observation [x1, x2, x3 ... xn] what sorted in any direction:
- if n is even, Median = average of two middle values;
- if n isn't even Median = middle value;
µ = (x1+ x2 + x3 + ... + xn) / n;
or
µ = (x1/ n) + (x2 / n) + (x3/ n) + ... + (xn/ n);
Expected value = Mean (impossible to calculate its accuracy at sometimes) is sum of all values with multiply each to probability of it (its M also):
I think better to use weighted average where each pi replaced to the wi what is describe how is variable value important ... ?
Range is different between highest and lowest of any sets of n observation [x1, x2, x3 ... xn].
Percentile or Quantile
Its limits to exclude any data or point to any data or decrease sample (general observation).
Range between Q25 and Q75 is to describe no Normal Distribution (no source, practice) with median, also.

Variance
Standard deviation
Standard deviation is σ describe values around µ, if σ is low - values tend to be close to the mean or if σ is high - values are spread around the mean.
For any sets of n observation x1, x2, x3 ... xn,
Standard deviation = σ = sqrt([(x1 - µ)2 + (x2 - µ)2 + (x3 - µ)2 ... (xn - µ)2] / n);
Correlation coefficient
.png)
Probability theory


.svg.png)
Events: dependent or independent or possible as fact in the future or understandable
Can I set them as depend?What will easily to end ...But the job to using sum,It's a job, that isn't come!
Dependent or independent events: If one event have been it's change "conditions" for the any event in the future? No - they are independent; Yes - they are dependent;
Independents events, example: each time in casino, chance to get red or black is 16/38 ... each game don't change it, never.
Completed probability = P1 * P2 * ... * Pn;
Conclusions what I can: ...
Conclusions what I can: ...
The dead penalty is request for the people about method how to exclude high risk to the people. It is possible from many social rules completely, also use Probability Theory only isn't effective here, but maybe can help;
Conclusion, how to: best past practice if I have them or do research or use alternative knowledge ...
Real elections organisation is alternative to calculate probability. Do request to peoples what they think, save it on the paper, exclude opinion changing, use these data to conclusion - who is winner. If I don't work in election organisation it will not give me result - what do job to get probability isn't effective.
Conclusions what I can: await when independent events will be or wait dependent event will be or create as dependent events ...
Also if I have information about election where win democrat with his program ... I can predict future more easily ... Focus here on the simple amount of the data, than create place for simple terms without work with uncontrollable data - this job was creating without me.
But it's job also ... That possible to do, possible to predict: who do it, their ability, possible quality, how many data need to analyze, how is difficult to get these data ... not full list of important questions.
Representative sets or clear data is rule!
- Must provide equal chance for each x into to be in the sample [x1, x2, x3 ... xn], what provide real representative sample;
- Size of sample of [x1, x2, x3 ... xn] is reasonable where excluded conflict between: costs profit, risk, result;
- Possible what Random generator of Python or any programmer language can do it, because have distribution as horizontal line;
- .... ;
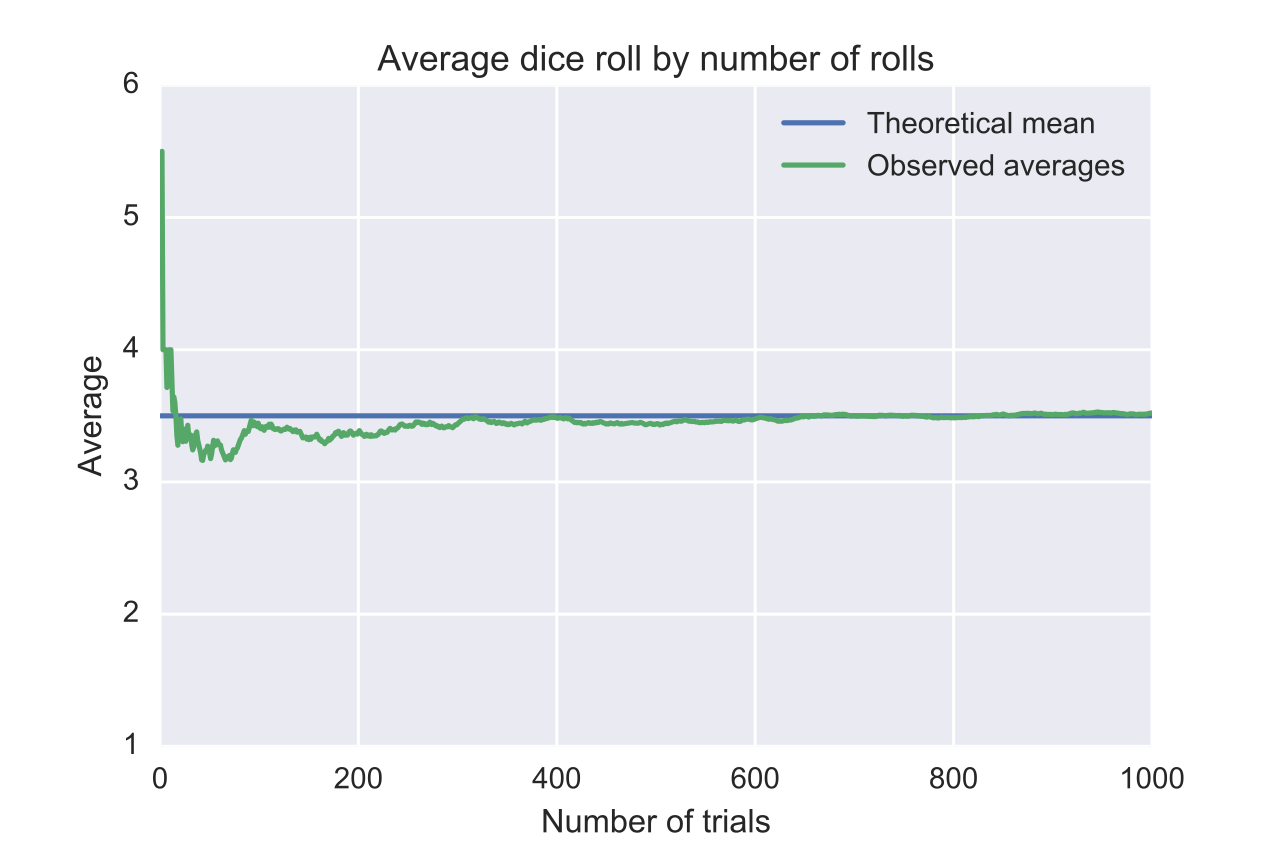
The Central Limit Theorem
Russian, France: many random variables with low corresponds between them, without domination of each of them, have distribution around of Normal Distribution.
Japan: many random values provide not only Normal Distribution, where mean and σ will be more convergences with mean and σ of each sample, when sample is large. Example: its using to understand size to the sample that provide result equal to general observation.
Example: Athletes who have specific weight all time. I can know what any group of people isn't athletes if I know important measures what describe athletes - weight or anything. Also, σ will be nearest or another attributes.
- Mean, σ, other attributes of sample will corresponds to general observation attributes;
- Samples is corresponds between them if they are from the one general observation;

Important to set unique measures (variables) to general observation to exclude mistakes to exclude problem. Example: Athletes and dancers who have similar weight, but they are from various distributions.
Conclusion of the results
- This medicine effective to this cold disease (zero hypothesis);
- It's an accident - medicine not effective (alternative hypotheses);
- Zero hypotheses is what we have accepted as true at begun;
- We want to alternative hypothesis what will be false if zero hypothesis will be true;
- First step: check mean of any value of the sample and compare it with mean of the equal value of the previous statistics. Possible to compare two groups by any single value where we will check affect from the another value;
- All samples where mean distant on 2 x SE or more of general observation mean - lie, what is abstract limit that possible to change. Need to set this limit before research;
- It's only counting values without checking actual state of affairs. Impossible to set weight (how it's important) here;
- Complete compare: 2 x SE or less different between means for 95% of samples, σ will be equal if sample is representative;
- Example from the education test: many fixed mistakes into the education exam have chance around 0.0001% to be. It show what we need to check this, because its rally impossible in the many exams in the past;
- Abstract example: cancer chance will less if people eat bran bun each day, because different between means of two group (who eat and who don't eat it) will be more than 2 x SE;
- Zero hypothesis - brain size don't affect to the autism disease;
- Alternative - brain size affect to autism disese;
| Group #1 | Group #2 |
| Children with autism | Children without autism |
| 59 | 38 |
| brain size, mean = 1310,4 cm2 |
brain size, mean = 1238,8 cm2 |
| different between means = 71,6 cm2 | |
| SE = 13 cm2 | SE = 18 cm2 |
| Range of 2 x SE is 1284,4 - 1336,4 cm2 |
Range of 2 x SE is 1202,8 - 1274,8 cm2 |
| p-value = 0,0002 chance that zero hypothesis is true. | |
| But it isn't 100% all time, need to set limits, and understanding where some mistakes will admissible. |
|

Regression analysis
- The first is “when done properly”;
- The second important is “help us estimate”;
- Dependent variable - what need to explain, what is changes;
- Explanatory variables - what is using to explain the dependent variable, it's hold or changes;


- Why does people have various salary?
- Why does woman have no equal to man salary?
- Why does any employee life is less?
- How does overwork at work affect the risk of cardiovascular diseases?

II. "Do Not Use Linear methods When There Is Not a Linear Association between the Variables That You Are Analyzing", example without linear association. Linear coefficient don't describe association here, it will lie what provide mistakes:

[!] Completely, two important terms about regression analyse:
- Logical searching to get variables what need to include into the regression expression, compose this expression, how to understanding result of the research;
- Regression analyse can show association only, now causing. We want to easy do repeatable research what confirm previous conclusion. Allow to do it more time without problem. Single research what impossible to repeat it's not science - it's pure chance;
- To get linear graph I need two points;
- Maybe it's extreme points [I can change it to another function to be nearest of the "best" example of the relationship] or use specific methods to work with no linear association or use standard methods for linear association or ... ?
- I want to many explanatory variables, to do estimate is possible, because they are not percent or equal to absolute values. Regression analyse provide new values what possible to compare between them, only!
- It's predictable, because they in the various measures;
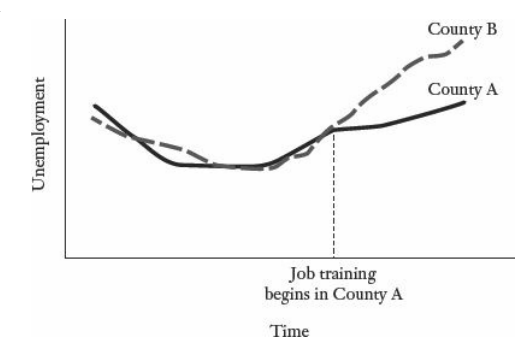
Program Evaluation [Where its possible ...]
Five question where statistics can ask
- Can help where we want opinion what based on large amount of experience as statistics (court or equal task where need personal solution).
- Can help where we want associate to understand way to find causes of the problem (diseases).
- Can help where we aren't measure (intelligence level).
- Where we have really groups of people and want to compare them or understand how they work (agriculture in the various places or by various employee).
- Can help where we have statistics to do better relationship (customers with shop).
.png)
Polling
- Polling is one form of the conclusion of the statistics result, what is data that equal term what we set to collect them;
- But need to do it of representative sample, also;
- SE = sqrt(p(1 - p) / n);
- SE = 0.02 provide +/- 2% to change to percentage result of the base term;
- Result of will be with: 1 x SE for 68% of samples; 2 x SE for 27% of samples; 3 x SE for 4.7% of samples; ... ;
- Isn't bad if I have two terms what exclude each other to compare result of them after polling; But how to ask about anything, one people - twice?
- Possible to increase representative sample size, to decrease SE value;
- How to do polling to percents what will equal to result of real election? How to do organisation of these polling? Hm ...;
Percentage
Tree of the variants
111110100
.png)
11100100
.png)
Repeatable research
- Repeatable research can help to fix various mistakes and help to planing, because I know that plan is nothing, planning it's all;
- If I need to compare any research need to check that their data are equal and I wasn't lost important data in the past;
- Long term research provide information to get causal relationships;
- I think it's because I can't set right term or rules the first time;
Expected value for choose the game ...
- ki - probability of the victory in the game;
- Rewardi - reward to the winner;
- i ∈ [1;n] where n = count of tests;
- I can compare various expected values to choose better game or way in the one game or many way in the many games or ... ;